


Agglomerative vs. Divisive: Two Approaches
Hierarchical clustering comes in two flavors. Agglomerative starts with every client as their own group, then merges similar ones together. It's like starting with 500 individuals and gradually combining them into larger segments. Divisive does the opposite — starts with everyone in one big group and recursively splits.
Most people use agglomerative because it's computationally cheaper and easier to interpret. You watch the merging happen step by step. At each merge, you're combining the two closest clusters based on your chosen linkage criterion. That's the magic part — how you measure "closest" changes everything.
Linkage Criteria Matter
- Single linkage: Distance between nearest neighbors. Creates long chains.
- Complete linkage: Distance between farthest neighbors. More compact clusters.
- Average linkage: Mean distance between all pairs. Balanced middle ground.
- Ward linkage: Minimizes within-cluster variance. Best for portfolio analysis.
Reading the Dendrogram
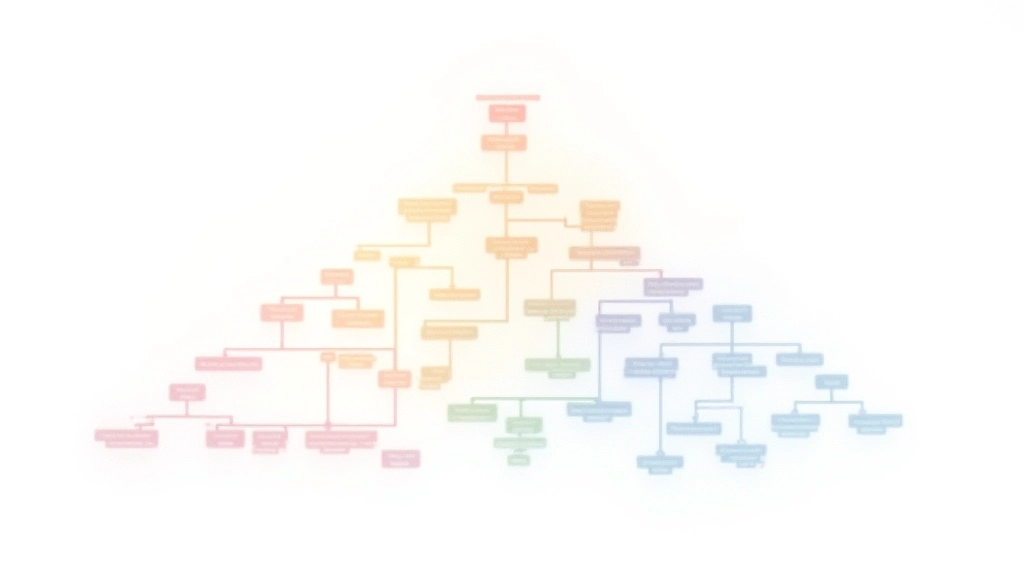
The dendrogram is your visual roadmap. Each leaf at the bottom represents one client. Branches merge upward, and the height of each merge tells you how different those clusters were. A low merge point means those groups are similar. High up? They're quite different.
Drawing a horizontal line across the dendrogram at any height gives you a clustering solution. Cut at height 5 and you might get 8 segments. Cut at height 10 and maybe 4. This is powerful because you're not guessing the number of clusters beforehand. You're discovering it from the data structure itself.
We've found that looking for "elbows" in the dendrogram — where the merge heights jump noticeably — often reveals natural client groupings. That's where the real business insights hide.
Individual learning outcomes vary from person to person. The techniques and examples shown here are educational in nature. Your actual clustering results will depend on your specific data, preprocessing choices, and business context.
Distance Metrics: Euclidean vs. Others

Euclidean distance is the default — it's the straight-line distance between two points in your feature space. But it's not always the best choice. If your features have different scales (asset values in millions vs. years as a client), Euclidean gets skewed. That's why you normalize first.
Manhattan distance (sum of absolute differences) works better when you've got outliers. Correlation distance focuses on pattern similarity rather than magnitude. For fund characteristics, we've had success with standardized Euclidean after scaling all features to mean 0 and standard deviation 1.
The choice matters more than people realize. Different metrics can produce wildly different dendrograms from the same data. Always test a few and see which one produces segments that align with your domain knowledge.
Practical Steps: From Data to Clusters
Prepare Your Data
Gather client features: portfolio size, fund preferences, investment horizon, risk tolerance. Remove duplicates, handle missing values. Standardize all numeric features.
Choose Your Linkage
Start with Ward linkage for balanced clusters. If you need to find extreme outliers, try single linkage. For stable, round clusters, go complete.
Build the Dendrogram
Run the agglomerative algorithm. This creates your tree structure showing all possible cluster solutions from 1 to N groups.
Cut and Validate
Look for natural elbows in merge heights. Test 2-5 different cut heights. Validate with domain experts — do the clusters make business sense?

Why It Works for Client Segmentation
Hierarchical clustering shines when you're mapping client relationships. You're not just splitting people into buckets — you're discovering how similar they actually are at different scales. A dendrogram tells you which clients are nearly identical twins, which ones are similar enough to share a strategy, and which ones stand alone.
This matters for fund allocation. Two clients might both be "growth-oriented," but the dendrogram shows you one is conservative-growth while the other is aggressive-growth. They cluster together at a high level but separate lower down. That insight guides your portfolio recommendations.
The flexibility is also practical. Market conditions change. New client types emerge. Instead of re-running K-means and picking a new K, you've already got your dendrogram. Just look at different cut heights. It's efficient and transparent — clients can actually understand why they're grouped a certain way.