

K-Means Clustering for Fund Categorization
Learn how K-means partitions your fund data into distinct groups. Covers algorithm fundamentals, choosing K, and real fund segmentation scenarios.
Move beyond hard assignments with soft clustering. Learn how GMM provides probability distributions for each client segment, enabling nuanced understanding of fund allocation decisions.

K-means clustering gives you clear categories. A client belongs to Segment A or Segment B — nothing in between. But that's not how fund investors actually behave. People don't fit neatly into boxes. They're interested in growth and stability. They value income but also diversification. That's where Gaussian Mixture Models come in. GMM doesn't force clients into hard categories. Instead, it assigns probabilities. A client might be 70% likely to prefer conservative funds and 30% likely to be attracted to growth opportunities. That flexibility is powerful.
Hard clustering says "you're in group X." Soft clustering says "you're probably in group X, but might belong elsewhere." GMM gives you that probabilistic view, which reflects reality much better.
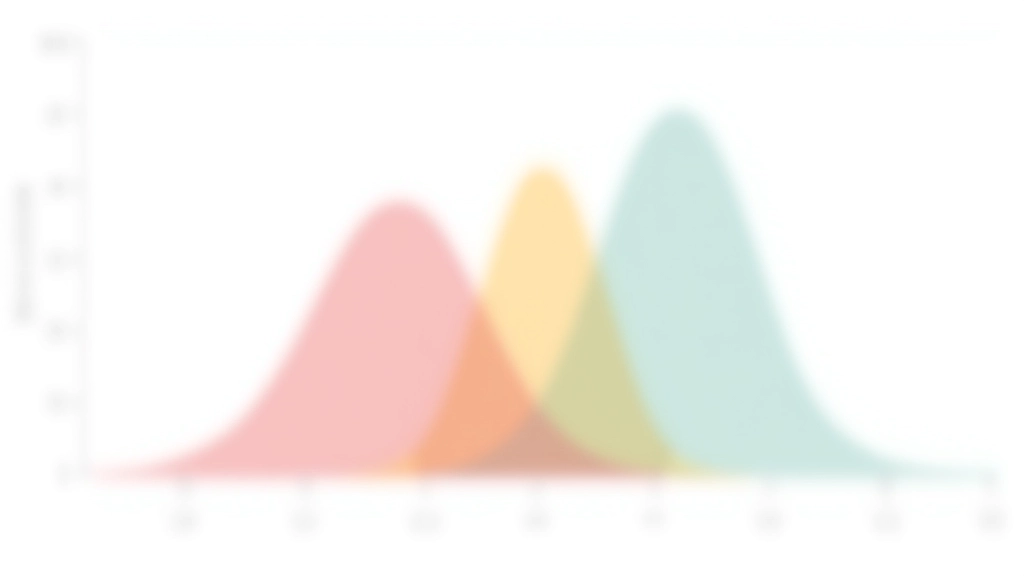
At its core, GMM assumes your data comes from multiple normal distributions mixed together. Imagine you're looking at fund performance data. You don't have one bell curve — you've got several overlapping ones. Some clients cluster around conservative returns (low volatility, steady gains). Others prefer aggressive growth (higher risk, higher potential). A third group might sit in between. GMM finds these distributions and calculates how much each one contributes to your overall data.
The algorithm works iteratively. It starts with a guess about where the distributions are, then refines that guess based on the actual data. After several iterations, it converges to a solution. You're left with: the center of each distribution (mean), how spread out it is (covariance), and how many clients belong to each component (mixing coefficients). These aren't hard counts — they're probabilities.
Remember: Individual learning outcomes vary from person to person. Your specific clustering results depend on your data quality, the number of components you choose, and how well the Gaussian assumption fits your particular fund categories.
This is where GMM becomes genuinely useful for fund segmentation. Each client doesn't get a single label. Instead, they get a probability for each segment. Say you've identified four fund preference groups: Conservative (steady income), Growth (long-term appreciation), Balanced (mixed approach), and Speculative (high-risk opportunities). A particular client might score: Conservative 0.45, Growth 0.35, Balanced 0.15, Speculative 0.05. They're primarily conservative but lean toward growth. You can't capture that with K-means.
These probabilities are invaluable for marketing and portfolio recommendations. You don't pitch speculative funds to someone with a 0.05 probability in that segment. You focus on their dominant preferences but acknowledge their secondary interests. It's more nuanced. More human. Your messaging can reflect actual client psychology instead of forcing them into rigid categories.
Collect client characteristics: fund holdings, risk tolerance scores, portfolio performance, trading frequency, withdrawal patterns. Standardize everything so different scales don't dominate. A client with $500k in assets shouldn't overshadow someone with more volatile trading behavior.
How many segments do you expect? This isn't obvious. Use the Bayesian Information Criterion (BIC) or Akaike Information Criterion (AIC) to test different numbers. Start with 3-5 and see what the data suggests. Too few components and you're oversimplifying. Too many and you're seeing patterns that don't exist.
Use Expectation-Maximization. Most statistical packages (scikit-learn in Python, for example) handle this automatically. The algorithm iterates until it converges, typically within 50-100 steps. You're solving for component parameters that maximize the likelihood of observing your actual data.
For each client, calculate the probability they belong to each component. These probabilities sum to 1.0. Assign clients to their most likely segment, but keep the full probability vector. That's where the real insight lives — in understanding degrees of membership, not hard categories.

Real fund investors aren't one-dimensional. They don't fit into neat categories. GMM respects that reality. It acknowledges that client preferences exist on a spectrum and that overlap is normal. When you segment your fund offerings using GMM, you're making decisions based on genuine client affinity, not artificial boundaries. You're recognizing that a client might be primarily interested in income funds but also attracted to balanced options. That insight changes how you market, how you recommend portfolios, and ultimately, how well you serve your clients.
The probabilistic approach also gives you built-in uncertainty quantification. You know which clients are clearly in one segment and which ones sit at the boundaries. That knowledge helps you understand where your segmentation strategy is most confident and where you might need additional client research. It's not just a clustering technique — it's a window into the actual complexity of your client base.
Ready to explore other clustering approaches? Learn about K-means fundamentals or discover how density-based methods handle outliers.
Explore K-Means Clustering
Learn how K-means partitions your fund data into distinct groups. Covers algorithm fundamentals, choosing K, and real fund segmentation scenarios.

Explore agglomerative and divisive clustering methods. Understand dendrograms, linkage strategies, and when hierarchy reveals more than flat clusters.

Discover density-based clustering and how it handles outliers naturally. Perfect for finding unusual fund performance patterns and edge cases.